Image


Sri Lanka made impressive progress in improving the health and nutritional status of its population between the 1970s and 2000. Advances have slowed in the last 15 years, however, resulting in high levels of undernutrition relative to gross domestic product and to infant mortality rates. In rural Sri Lanka, where 80% of the population live, stunting rates are now moderately high compared to other indicators of development.
[vc_row row_type=”row” text_align=”left” css_animation=””][vc_column width=”1/2″]

Lalith Chandradasa, National Nutrition Secretariat Coordinator reviews the success so far…[/vc_column_text][/vc_column][/vc_row][vc_row row_type=”row” text_align=”left” css_animation=””][vc_column][vc_separator type=”transparent”][/vc_column][/vc_row][vc_row row_type=”row” text_align=”left” css_animation=””][vc_column][vc_column_text custom_options=””]Sri Lanka made impressive progress in improving the health and nutritional status of its population between the 1970s and 2000. Advances have slowed in the last 15 years, however, resulting in high levels of undernutrition relative to gross domestic product and to infant mortality rates. In rural Sri Lanka, where 80% of the population live, stunting rates are now moderately high compared to other indicators of development. Moreover, the prevalence of wasting has remained unusually high and largely unchanged over the last three decades.[/vc_column_text][/vc_column][/vc_row][vc_row row_type=”row” text_align=”left” css_animation=””][vc_column][vc_separator type=”transparent”][/vc_column][/vc_row][vc_row row_type=”row” text_align=”left” css_animation=””][vc_column][vc_column_text custom_options=””]In response to stagnation in levels of under-nutrition, the President of Sri Lanka set up the National Nutrition Council (NNC), comprising ministers of 16 implementing ministries (relevant to scaling up nutrition) and selected Members of Parliament. The NNC is advised by a Technical Advisory Committee on Nutrition while implementation is monitored by a National Steering Committee on Nutrition comprising secretaries of the implementing ministries, chief secretaries of provinces and civil society representatives.
A special unit, the National Nutrition Secretariat, has been set up within the Presidential Secretariat and under the direct guidance of the Secretary to the President. This unit is responsible for nutrition coordination, monitoring of implementation and reporting. A five year Multi-sector Action Plan for Nutrition (MsAPN) was launched in December 2013. [/vc_column_text][/vc_column][/vc_row][vc_row row_type=”row” text_align=”left” css_animation=””][vc_column][vc_separator type=”transparent”][/vc_column][/vc_row][vc_row row_type=”row” text_align=”left” css_animation=””][vc_column][vc_column_text custom_options=””]
The MsAPN takes a new approach to monitoring nutrition information and is putting in place a system which has two parts:
[/vc_column_text][/vc_column][/vc_row][vc_row row_type=”row” text_align=”left” css_animation=””][vc_column][vc_separator type=”transparent”][/vc_column][vc_column][vc_column_text custom_options=””]
The MsAPN has adopted five of the six key results areas that were agreed at the World Health Assembly (WHA) in 2012. The exception is the breastfeeding target which has already been met with exclusive breastfeeding levels standing at over 75%. The government is using the targets to monitor the impact of the MsAPN up until 2016. A total of 24 indicators have been identified under the five key results areas. Data collected in 2012 through the national nutrition and micronutrient survey conducted by the Ministry of Health are being used as baseline information. National and district profiles prepared on the basis of the baseline information, set individual targets for each district to be used by policy makers and implementers for easy reference. An end line national survey to cover all 25 districts in the country is planned for the end of 2016 to assess the impact and targets achieved. [/vc_column_text][/vc_column][/vc_row][vc_row row_type=”row” text_align=”left” css_animation=””][vc_column][vc_separator type=”transparent”][/vc_column][/vc_row][vc_row row_type=”row” text_align=”left” css_animation=””][vc_column][vc_column_text custom_options=””]
There are 16 ministries included under the MsAPN. For each ministry, a set of interventions have been identified with associated indicators. Progress reviews are conducted by the NNC every month to review programme coverage and access. A health information system is being set up by the Ministry of Health which will provide information every quarter on nutrition specific interventions including coverage and access.[/vc_column_text][/vc_column][/vc_row][vc_row row_type=”row” text_align=”left” css_animation=””][vc_column][vc_separator type=”transparent”][/vc_column][/vc_row][vc_row row_type=”row” text_align=”left” css_animation=””][vc_column][vc_column_text custom_options=””]
The MsAPN was based on the lessons learnt from pilot projects in two districts of Sri Lanka (Monaragala and Nuwara Eliya) where rates of under-nutrition are high. With the support of the United Nations Children’s Fund (UNICEF), a multi-sectoral approach was operationalized based on multi-sectoral District Nutrition Action Plans.
The approach:
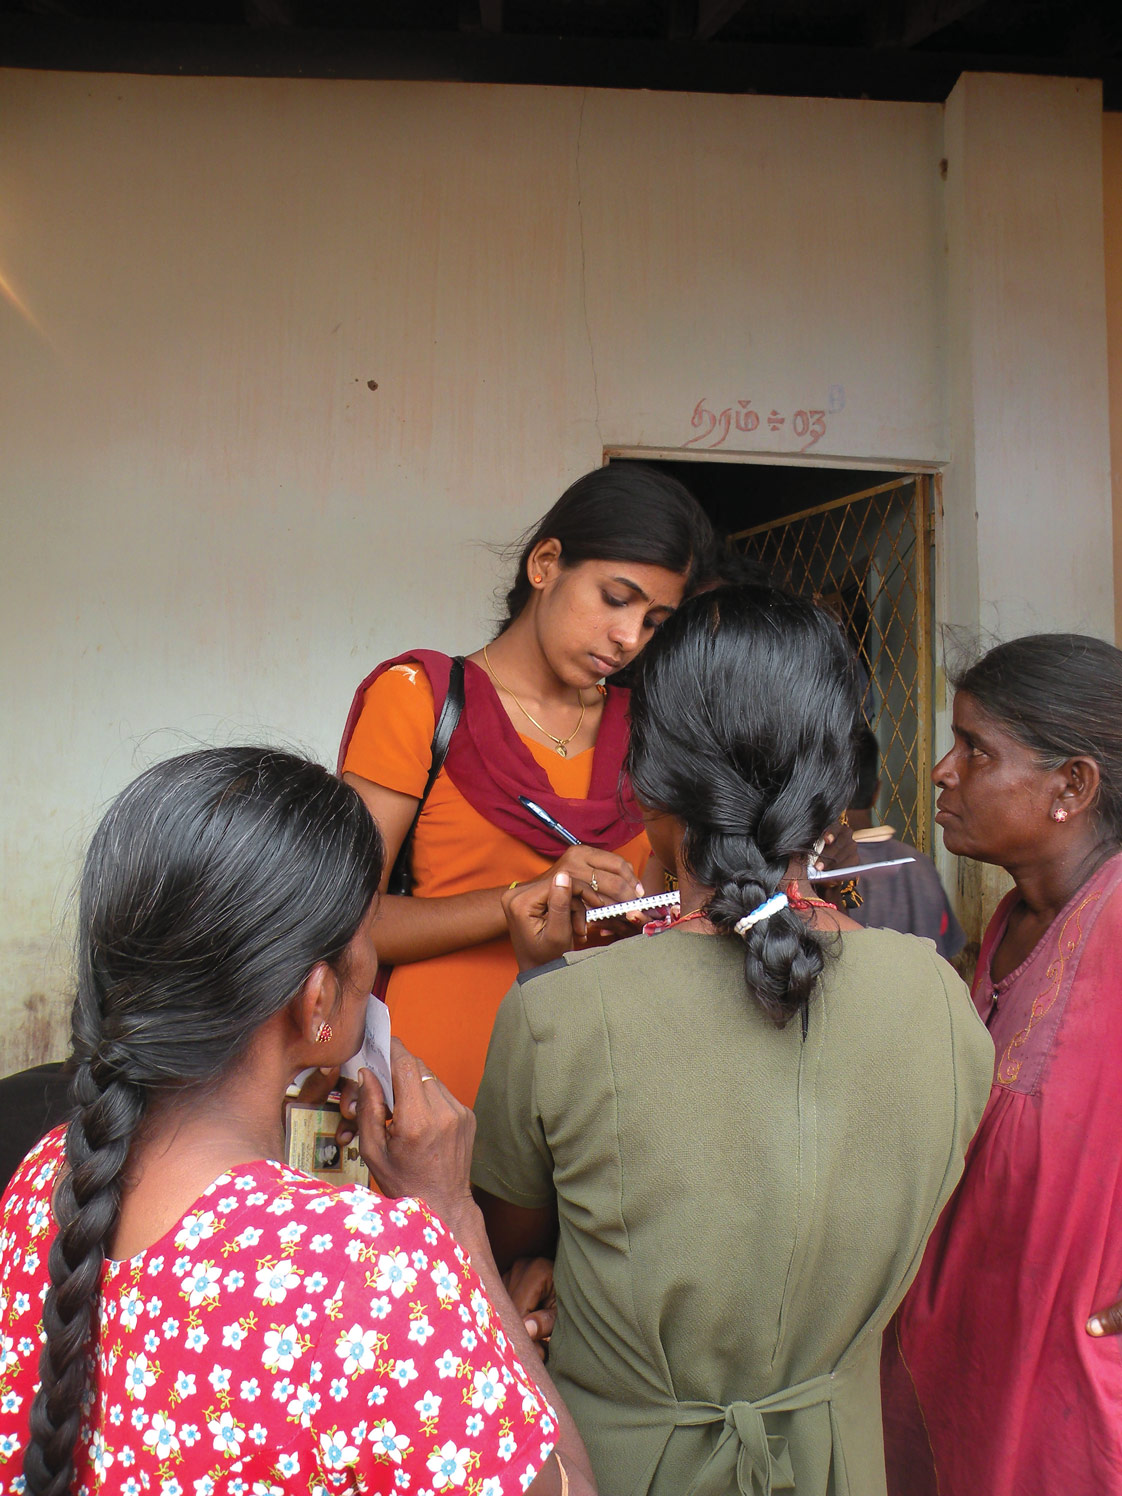
The information system identifies and targets vulnerable families. Public health
midwifes8 (PMHs) identify nutritionally-atrisk households in each ‘Grama Niladari’ area, the smallest administrative unit in the country, using monthly records and four criteria:
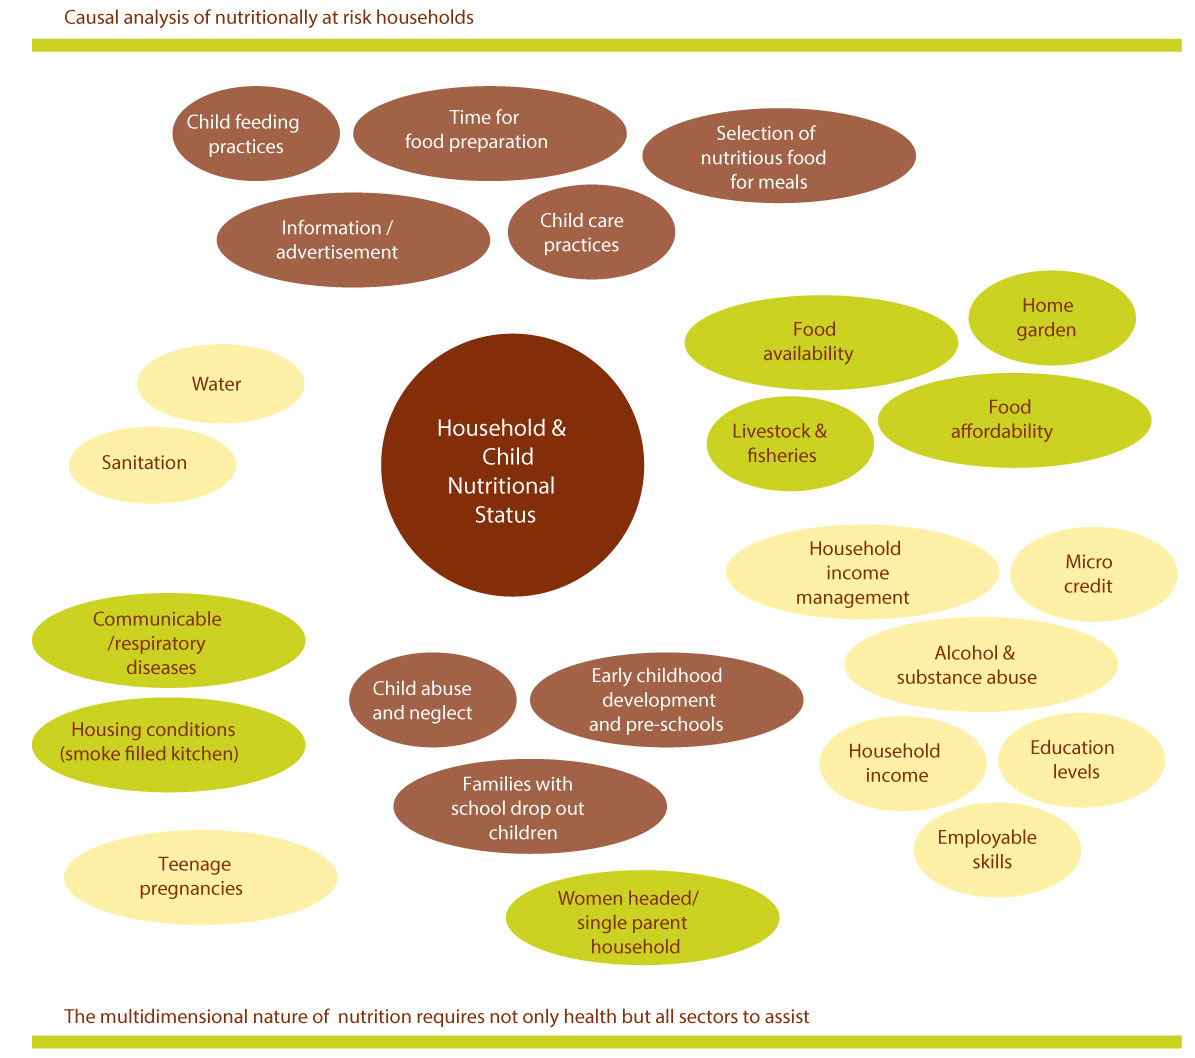
Village level officials from the ministries of health, agriculture, economic development, and child development & women’s affairs are deployed to carry out a causal analysis of the nutritionally vulnerable households. Seven causal factors under 34 sub headings are considered:
The village development officer with the assistance of the planning section of the divisional secretariat summarizes the information collected and sends it to the division. This is the level at which different sectoral interventions are planned for the village level. Division coordinating committees discuss the analysis of the data in monthly progress review meetings. The information is then transmitted from all divisions to district and provincial level to be discussed at their respective committees.
[/vc_column_text][/vc_column][/vc_row][vc_row row_type=”row” text_align=”left” css_animation=””][vc_column][vc_separator type=”transparent”][/vc_column][/vc_row][vc_row row_type=”row” text_align=”left” css_animation=””][vc_column][vc_column_text custom_options=””]
The responsibility to rectify and respond to the issues identified depends upon the causal analysis. For example, households with identified economic problems may
[/vc_column_text][/vc_column][/vc_row][vc_row row_type=”row” text_align=”left” css_animation=””][vc_column][vc_separator type=”transparent”][/vc_column][/vc_row][vc_row row_type=”row” text_align=”left” css_animation=””][vc_column][vc_column_text custom_options=””]receive financial or technical assistance or equipment. A multi-sectoral group is activated to create employment opportunities, provide motivation for going to work every day, provide motivation for additional earning possibilities and provide direct nutrition support. Where household food insecurity is identified as a problem, agricultural staff are responsible for raising awareness about food security and supporting households in home gardening efforts. All sectors are involved to ensure effective responses to households identified as vulnerable.[/vc_column_text][/vc_column][vc_column][vc_separator type=”transparent”][/vc_column][/vc_row][vc_row row_type=”row” text_align=”left” css_animation=””][vc_column][vc_column_text custom_options=””]
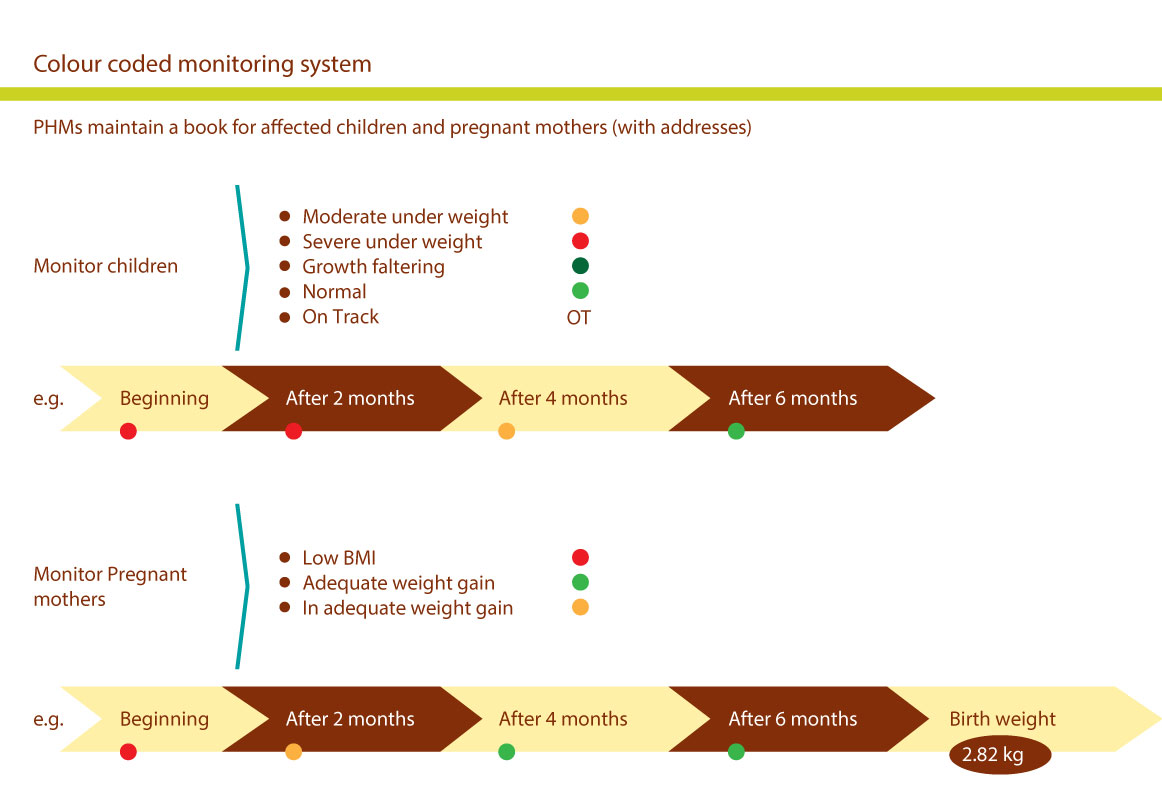
The PHMs maintain a separate register for priority households and use a colour coding system for each household to visualize its progress. Results in the two districts over the three year pilot period have shown encouraging results. In Monaragala, stunting rates among children below five years fell from 18.5% to 14.2% while in Nuwara Eliya, they fell a staggering 17 percentage points from 40.9% to 23.8%. Reductions in stunting have not been reflected in decreased wasting and iron deficiency rates, however, suggesting that specific actions to address micronutrient deficiencies and wasting need to be strengthened. [/vc_column_text][/vc_column][/vc_row][vc_row row_type=”row” text_align=”left” css_animation=””][vc_column][vc_separator type=”transparent”][/vc_column][/vc_row][vc_row row_type=”row” text_align=”left” css_animation=””][vc_column][vc_column_text custom_options=””]
The monitoring system will now be implemented nationally, expanding to cover all divisions in 10 priority districts in Sri Lanka during 2014 and then to cover each of the 331 divisions9 in all 25 districts of the country. The system will rely on the collection of data using a uniform questionnaire from the 14,022 ‘Grama Niladari’ areas, which have populations of approximately 1,500 – 3,000 people. Data collection will provide employment for university graduates under the Ministry of Economic Development who will provide training. The same multi-sectoral system of identification, causal analysis and response will be applied as for the pilot projects.[/vc_column_text][/vc_column][/vc_row][vc_row row_type=”row” text_align=”left” css_animation=””][vc_column][vc_separator type=”transparent”][/vc_column][/vc_row][vc_row row_type=”row” text_align=”left” css_animation=””][vc_column][vc_column_text custom_options=””]
Currently, some of the information on impact and implementation is available through reports, bulletins and via the website of the relevant ministries. In addition, information is distributed through a public forum initiated by the Presidential Secretariat. A web-based database to track implementation and a social media platform to engage the general public together with a comprehensive social media strategy to promote nutrition are planned for the near future. Already, the state media channels have committed airtime and coverage for key nutrition related messages during peak times. [/vc_column_text][/vc_column][/vc_row][vc_row row_type=”row” text_align=”left” css_animation=””][vc_column][vc_separator type=”transparent”][/vc_column][/vc_row][vc_row row_type=”row” text_align=”left” css_animation=””][vc_column]