Image

Developing a dashboard of indicators
Namibia has undertaken an ambitious project to develop and pilot a dashboard of indicators for improved nutrition. The purpose of the dashboard is to ensure that information collected is linked to coverage of interventions and can be used to inform decisions at all levels. The dashboard is part of Nambia’s new Multi-Sectoral Nutrition Implementation (2012/2013 to 2015/2016).
April 1, 2014 - Last update: February 10, 2023
[vc_row row_type=”row” text_align=”left” css_animation=””][vc_column width=”1/2″]

Namibia is tracking progress using a dashboard of indicators.
Marjorie van Wyk, Chief Health Programme Administrator, Subdivision: Food and Nutrition, Ministry of Health and Social Services and SUN Government Focal Point with others 10
describes efforts to…[/vc_column_text][/vc_column_inner][/vc_row_inner][/vc_column][/vc_row][vc_row row_type=”row” text_align=”left” css_animation=””][vc_column][vc_separator type=”transparent”][/vc_column][/vc_row][vc_row row_type=”row” text_align=”left” css_animation=””][vc_column][vc_column_text custom_options=””]Namibia has undertaken an ambitious project to develop and pilot a dashboard of indicators for improved nutrition. The purpose of the dashboard is to ensure that information collected is linked to coverage of interventions and can be used to inform decisions at all levels. The dashboard is part of Nambia’s new Multi-Sectoral Nutrition Implementation (2012/2013 to 2015/2016). The endorsement of the plan marks a major achievement for Namibia requiring the commitment of many sectors, from community to national level, in government and among development partners.[/vc_column_text][/vc_column][/vc_row][vc_row row_type=”row” text_align=”left” css_animation=””][vc_column][vc_separator type=”transparent”][/vc_column][/vc_row][vc_row row_type=”row” text_align=”left” css_animation=””][vc_column][vc_column_text custom_options=””]
Sources of nutrition information
Survey data
The demographic and health survey (DHS) is the main source of nutrition related data in Namibia. Data are disaggregated by region, wealth, gender, livelihood and age. The DHS is, however, only carried out every five years, at a minimum. The most recent DHS was carried out in 2013 and the results are pending. The key indicators of relevance for nutrition are stunting, wasting and underweight in addition to infant and young child feeding practices covering breast feeding and complementary feeding.
Data relating to the determinants of malnutrition are collected via a number of instruments such as the national income and expenditure survey, which provides information on sanitation, poverty and deprivation, and the national census which also provides information on sanitation and water access. Both data sets are disaggregated by region, wealth, gender and age group.
A national Infant and young child feeding survey will be carried out in 2014, which will give valuable insights into the current practices of parents and caregivers in relation to breast feeding, complementary feeding, food consumption, play and early childhood stimulation. This information will enable the Ministry of Health and Social Services (MoHSS) to better target their communication materials.
[/vc_column_text][/vc_column][/vc_row][vc_row row_type=”row” text_align=”left” css_animation=””][vc_column][vc_separator type=”transparent”][/vc_column][/vc_row][vc_row row_type=”row” text_align=”left” css_animation=””][vc_column][vc_column_text custom_options=””]Early warning system
During times of emergency such as drought, floods or disease outbreak, rapid assessments are carried out whereby data are collected on nutrition sensitive indicators. The Namibian vulnerability assessment is carried out annually. It reports on food security, vulnerability indicators and livelihoods. It relies on secondary nutrition data sources, however, and because the nutrition information system is currently weak, nutrition information is often excluded. Regular reports and daily flood bulletins released by the meteorological bureau provides information on climatic events such as floods and potential drought situations. This information is fed into the vulnerability assessment, which is used as early warning of need requiring a rapid response in the case of an emergency.
[/vc_column_text][/vc_column][/vc_row][vc_row row_type=”row” text_align=”left” css_animation=””][vc_column][vc_separator type=”transparent”][/vc_column][/vc_row][vc_row row_type=”row” text_align=”left” css_animation=””][vc_column][vc_column_text custom_options=””]Routine data collection
The national health management information system includes data on in-patient and out-patient admissions, in which malnutrition is reflected through a diagnostic code. Capturing data on nutrition specific interventions from routine data recorded in health facilities, however, is a challenge due to the inadequacies of the data management system. Improving this system is a priority in 2014, particularly with regard to monitoring of the nutrition assessment, counselling and support (NACS) programme. NACS is Namibia’s version of community management of acute malnutrition. It aims to identify and treat cases of acute malnutrition (wasting). In late 2012, the MoHSS conducted a review of the NACS programme.
Data on health facility admissions for acute malnutrition are collected manually and recorded in a register from which information is collated into a summary form. There are significant variations between health facilities in the quality of data recorded, and health facility data recording and reporting were identified as key areas needing improvement. The information produced is not routinely used for programme monitoring and due to inconsistencies across regions11 there is little confidence in the reliability of the data.
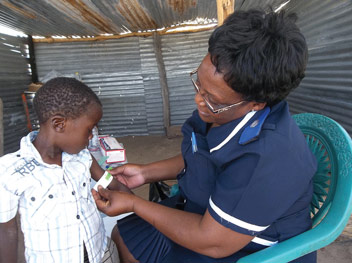
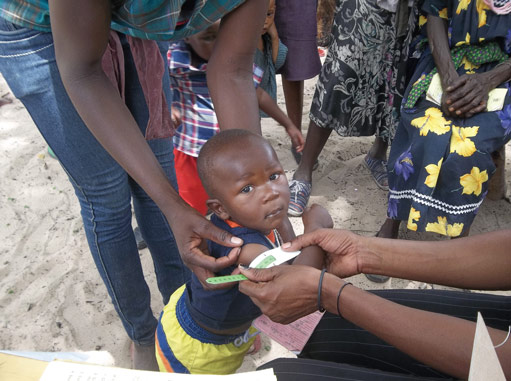
Data relating to acute malnutrition are also routinely collected during annual maternal and child health week activities. Children under five are screened for acute malnutrition using mid-upper arm circumference (MUAC). The information is comprehensive in that all children are measured. [/vc_column_text][/vc_column][/vc_row][vc_row row_type=”row” text_align=”left” css_animation=””][vc_column][vc_separator type=”transparent”][/vc_column][/vc_row][vc_row row_type=”row” text_align=”left” css_animation=””][vc_column][vc_column_text custom_options=””]
Information on programme implementation
Information on planned and achieved geographical programme coverage is obtained via various reports. For example immunisation campaigns report on delivery of vitamin A and deworming tablets and screening for acute malnutrition. Information on the number of health
facility staff trained in various areas of nutrition are also available from reports. NACS reports provide information on the number of people accessing the programme though it is acknowledged that there are reporting errors and weaknesses in the current system that may result in under-reporting.In addition, national reviews have been undertaken. Namibia has conducted a Landscape Analysis to Accelerate Actions to improve maternal and child nutrition in Namibia in September 2012 as well as the NACS review in 2013. This was the first time that these types of assessments have been conducted at a national level in Namibia.
The two assessments focused on knowledge and skills of health workers on nutrition, availability of resources, quality of service provision, barriers to nutrition service provision and client awareness and uptake of, and satisfaction of services provision.[/vc_column_text][/vc_column][/vc_row][vc_row row_type=”row” text_align=”left” css_animation=””][vc_column][vc_separator type=”transparent”][/vc_column][/vc_row][vc_row row_type=”row” text_align=”left” css_animation=””][vc_column][vc_column_text custom_options=””]
 [/vc_column_text][/vc_column][/vc_row][vc_row row_type=”row” text_align=”left” css_animation=””][vc_column][vc_separator type=”transparent”][/vc_column][/vc_row][vc_row row_type=”row” text_align=”left” css_animation=””][vc_column][vc_column_text custom_options=””]
Using information to advocate for nutrition
Regional nutrition profiles were produced in 2010 and have been used as advocacy tools to raise awareness about the nutrition situation at district, regional and national levels. The profiles were part of a broader publication set developed in 2010 to highlight the 2006/07 DHS indicators for nutrition. The profiles were used during regional nutrition roadshows, hosted by regional governors with participation from national level teams. The aim of these roadshows was to raise awareness among regional authorities about the nutrition situation and to motivate them to commit to action.
Highlighting the increase in the prevalence of stunting and wasting between 2000 and 2006 effectively secured the attention of high level government officials such as the then Prime Minister, Honourable Nahus Angula who subsequently joined the SUN Movement Lead Group.
Pending the results of the most recent DHS, there is an intention to update the regional profiles. These will again be used for advocacy purposes, especially since there are 2010 versions for comparison. [/vc_column_text][/vc_column][/vc_row][vc_row row_type=”row” text_align=”left” css_animation=””][vc_column][vc_separator type=”transparent”][/vc_column][/vc_row][vc_row row_type=”row” text_align=”left” css_animation=””][vc_column][vc_column_text custom_options=””]
Highlighting links between nutrition and WASH
Currently, there is no system in place to link nutrition data with programme implementation. There are, however, examples of where links are being made. For example, national sanitation coverage is 48% and the programme to increase sanitation coverage is not achieving its target. It is assumed that the low sanitation coverage contributes to the stunting rate which remains at 29%. Under a broad water, sanitation and hygiene (WASH) programme, community led total sanitation (CLTS)12 is being piloted in selected communities where rates of open defecation are extremely high. The impact of CLTS is being assessed using the indicator of wasting in children. In addition to this indicator, the presence of helminths is being monitored. Baseline data for both indicators are available and will be used for comparison. The inclusion of these two indicators in the WASH pilot have increased awareness and commitment amongst the WASH sector about the implications of poor sanitation on nutrition and ways to address this. The plan is to use maps to show areas where CLTS is implemented and relate these to areas where there is high incidence of wasting. Before and after maps will be developed to match CLT outcomes with nutrition outcomes. [/vc_column_text][/vc_column][/vc_row][vc_row row_type=”row” text_align=”left” css_animation=””][vc_column][vc_separator type=”transparent”][/vc_column][/vc_row][vc_row row_type=”row” text_align=”left” css_animation=””][vc_column][vc_column_text custom_options=””]
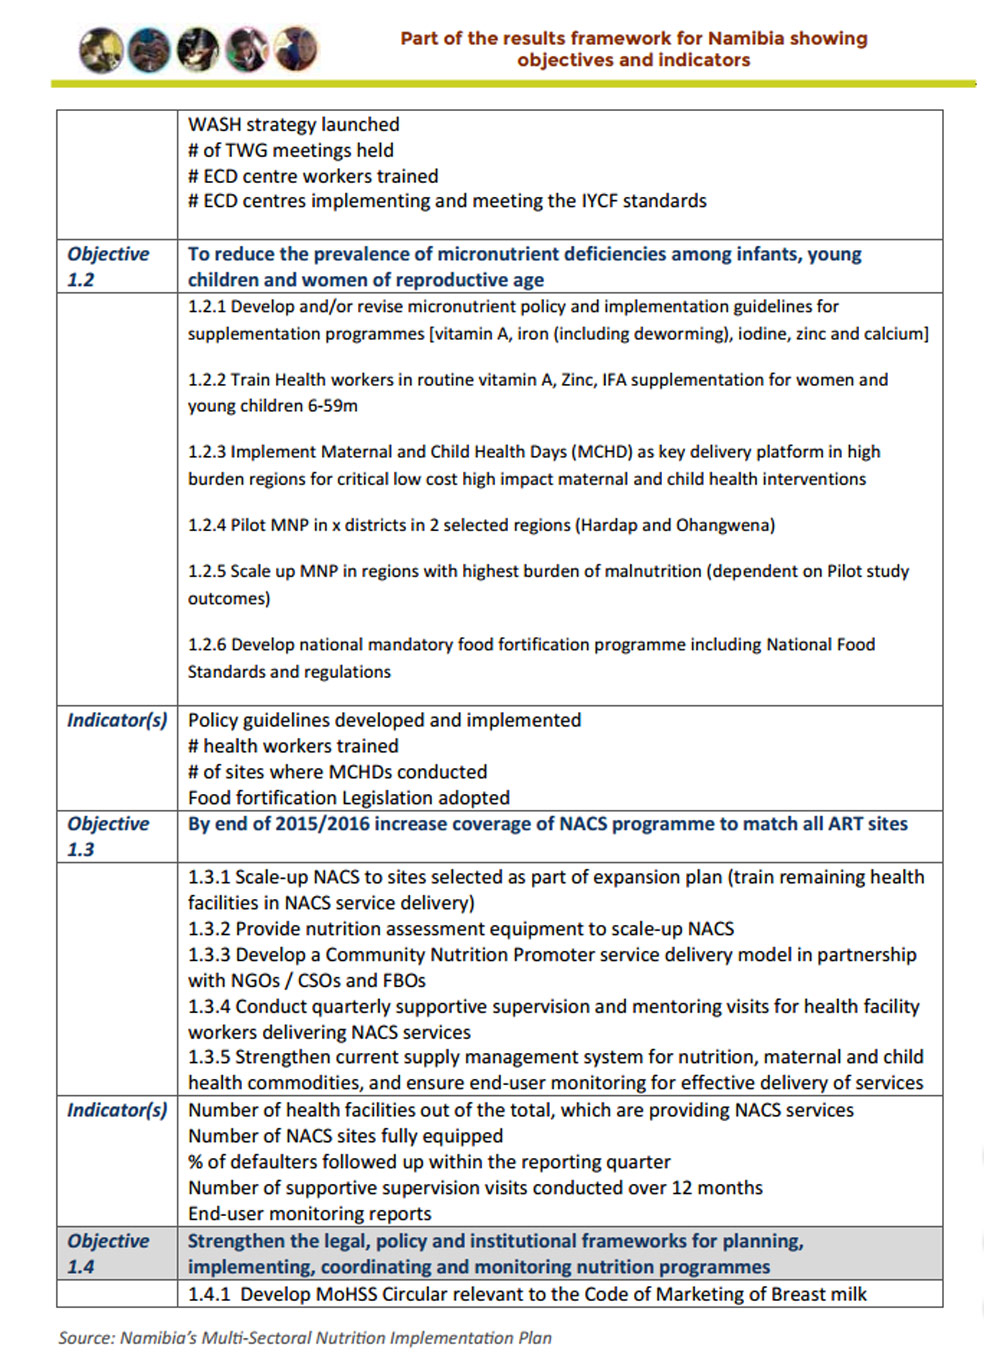
Results framework and dashboard of indicators
The aim of the results framework now incorporated into Namibia’s Multi-Sectoral Nutrition Implementation Plan, is to link intervention activities and reflect input, output and outcome indicators. The results matrix tracks progress against five key areas; 1) improvement in maternal, infant and young child nutrition status; 2) reduced burden of non-communicable disease; 3) improved resiliency to shocks that impact on nutritional status; 4) improved awareness of and commitment to national nutrition priorities; and 5) a functioning and effective monitoring and evaluation system.
The nutrition indicator dashboard will at any given point, indicate the status of progress towards achieving the set targets for each result area. The dashboard sets out baseline and targets for each indicator. Some of
the indicators are high level impact indicators such as stunting prevalence, while others are process or outcome indicators. Due to the substantial limitation in human resource capacity in Namibia, the first year of the Multi-Sectoral Nutrition Implementation Plan has a strong emphasis on process indicators such as training and supervision of knowledge transfer in practice.[/vc_column_text][/vc_column][/vc_row][vc_row row_type=”row” text_align=”left” css_animation=””][vc_column][vc_separator type=”transparent”][/vc_column][/vc_row][vc_row row_type=”row” text_align=”left” css_animation=””][vc_column][vc_column_text custom_options=””]
Challenges and opportunities
Namibia faces a number of challenges. Whilst there are many monitoring systems in place, information collected on nutrition specific interventions is still limited. Furthermore, there is a lack of coordination among the various systems and as a result most of the information gathered is not being properly analyzed and used for decision making. In addition, there is inadequate technical capacity within the government to analyze and report on the available information.
The Multi-Sectoral Nutrition Implementation Plan with its dashboard of indicators provides an opportunity for Namibia to link nutrition sensitive and nutrition specific interventions, including monitoring and evaluating
progress of implementation. Also, the Namibia food security monitoring system will provide an opportunity to generate timely, accurate and valuable information on the main indicators of food security and nutrition in the country.[/vc_column_text][/vc_column][/vc_row][vc_row row_type=”row” text_align=”left” css_animation=””][vc_column][vc_separator type=”transparent”][/vc_column][/vc_row][vc_row row_type=”row” text_align=”left” css_animation=””][vc_column]
Key Lessons
- Survey data can be developed into advocacy materials (regional profiles) to highlight nutrition and build political commitment for scaling up nutrition at the highest level. Profiles can be updated as new data becomes available.
- By building a results framework and indicator dashboard into national multi-sectoral nutrition implementation plans, progress across sectors can be monitored by comparing baseline and target data.
- A results framework and indicator dashboard can clearly show the link between intervention activities and inputs, outputs, outcomes and eventually impact.
- Measuring the success of interventions in different sectors (e.g. WASH) using nutrition indicators (wasting in children) is being applied in some areas.